
First, I’d like to discuss what I have been looking at up until this point. The GNU Go source file is rather large and finding a proper way to benchmark the Zobrist hash it implements was exhausting as many functions make up the overall hashing algorithm. I tried reaching out to the mailing address specified at the development website for the game to see a recommended path to take for testing the hash in the game but was left with no response (possibly the holidays are to blame this).
As discussed with my professor originally, optimizing the hash algorithm itself would probably see minimal if any improvements. With this in mind I moved my attention to looking at how the transposition table, where Go positions are the key and results of the reading for certain functions are the data, is structured. This seemed like it would be the best route to take for optimization of the Zobrist hash using TBL/TBX instructions on the data for quicker searches. These instructions reads each value from the vector elements in the index source SIMD and FP register, uses each result as an index to perform a lookup in a table of bytes that is described by one to four source table SIMD and FP registers, places the lookup result in a vector, and writes the vector to the destination SIMD and FP register. For those of you that don’t know what a transposition table does in the game of Go, I found this paper to have the clearest of explanations…
“A transposition is the new occurrence of a state previously processed during the execution of the search algorithm. Transpositions in Go can occur due to situations in which, for example, pieces are captured and the board state returns to a previous configuration. The objective of a TT is to avoid that already processed data are reprocessed unnecessarily. As it is possible in a game of Go the capture of a single piece, as well as a group of pieces, after a capture move is executed, the board state may return to a configuration that is differentiated from the previous state, by one, two or many more pieces.
The TT is implemented as a hash table which is a data structure that associates keys to values. Each key represents a state on the Go game-board and is associated with a given piece of information such as, board evaluation and already explored tree depth. The representation of the board state in the form of hash key is carried out using a technique de- scribed by Zobrist.”
Now I want to see how specific bits in the transposition table are being arranged as this relates to the overall effectiveness of the hashing algorithm. At this moment my thinking would be the best case scenario for these bits to be used would be in a lookup table that is capable of SIMD/vectorized instructions such as TBL/TBX. For this I will dig into the source code to figure out how the compiler options were set up at compile time and see if there is any chance we can pass the compiler any vectorization flags that aren’t used (if any at all). Now lets check out this transposition table in some more detail…
***Update for above: I have found the game engine was compiled using the -O2 flag which gives me hope that if I implement a -O3 flag some optimization will occur.***
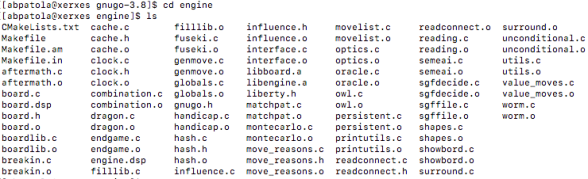
According to the documentation in the source files, the files that are of relevance to us are located in the engine directory, which looks like this…
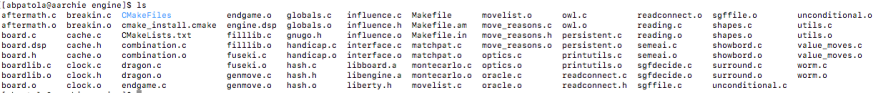
After peeking into all the files in this directory I found out that cache.h/cache.c together with hash.h implement the hashing of go positions using the Zobrist algorithm. When you go into cache.h the first thing you will notice is the definition oh a Hashnode, which is a node stored in the transposition table…
…The official GNU Go documentation also has some great reading on the organization of the hash table and the hash structures that are used in the game for the more curious…
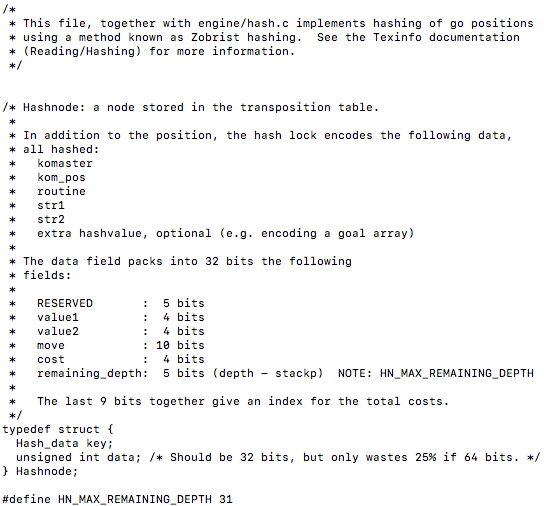
From this we can see by breaking down the 32 bits the unsigned int data holds what each particular bit is being allocated for. Following this, it defines what an Hashentry is and also does some right and left bitwise shifts with the data…
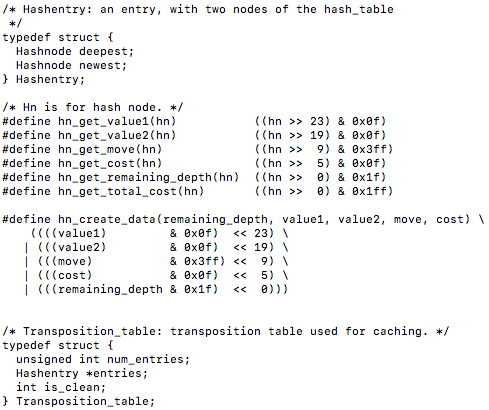
You will also notice the definition of a transposition table following the bit shifting operations. After looking at the header file, lets dive into the source file cache.c to check out the transposition table implementation…
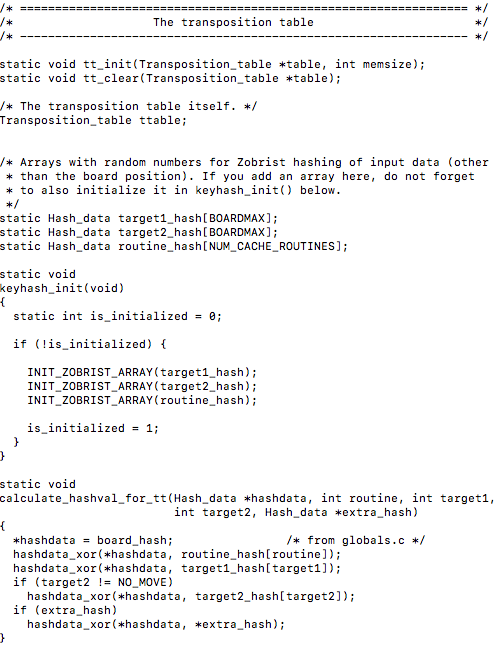
We can also notice a function that will use bitwise xor operations to calculate a hash value for the transposition table. Peering deeper into this file we can find a function that will initialize a transposition table as well as clear it up…
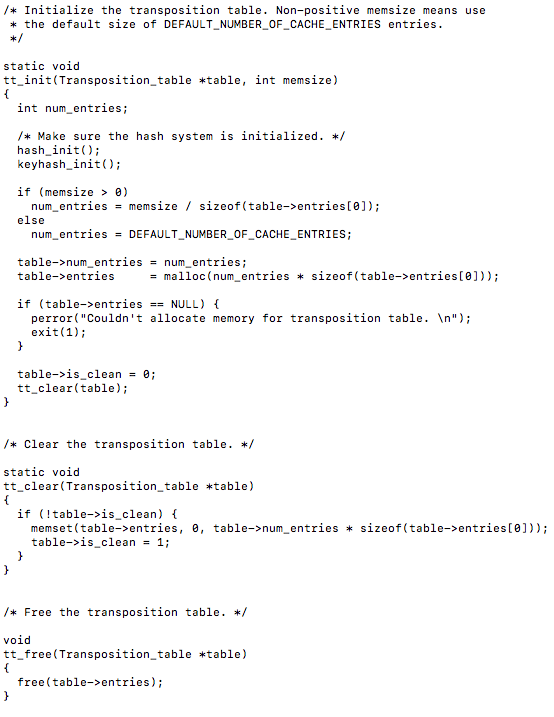
It is interesting to note the use of malloc() to allocate memory for the transposition table. There are two functions that I believe are most noteworthy to investigate further regarding the optimization aspect of things, these are tt_get() and tt_update(). The former is used to get a result and move then return a value, while the later updates a transposition table entry.
tt_get() :
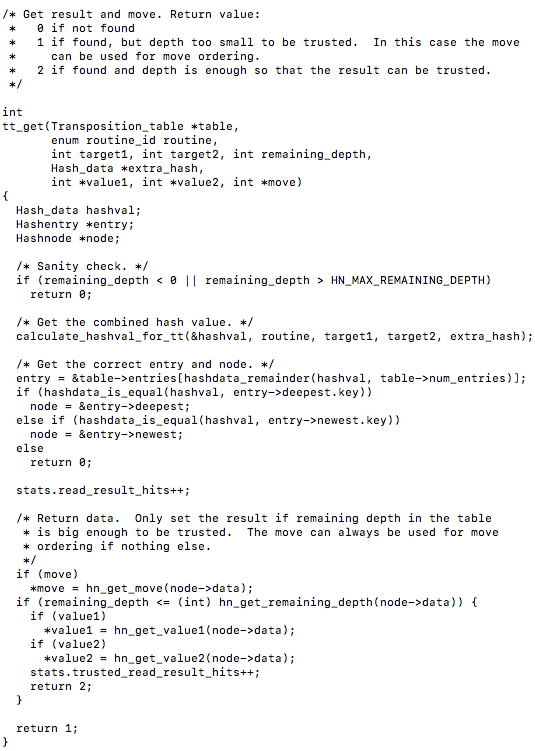
Its interesting to note the function parameters as they are the data which we investigated the particular bits of earlier.
tt_update() :
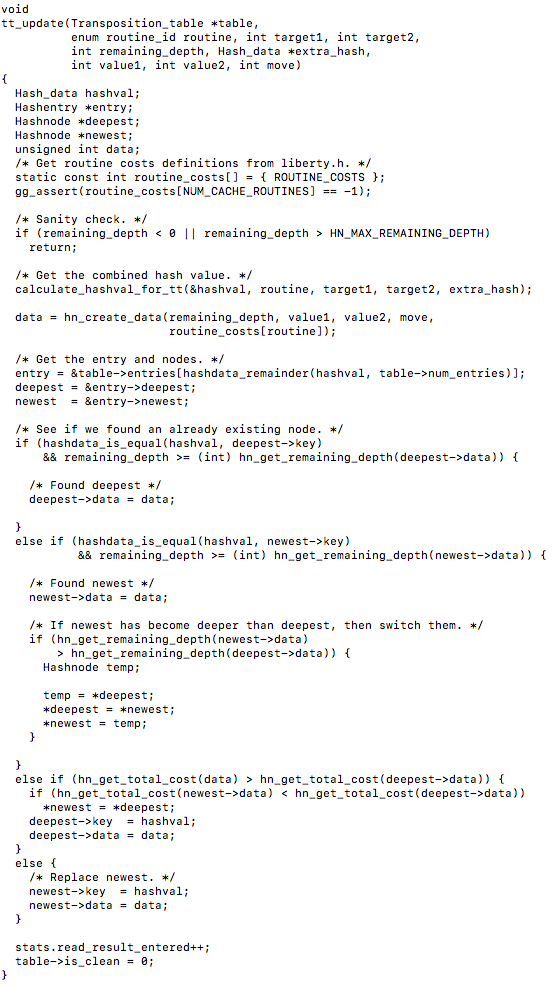
As we can notice above it gets a combined hash value for the transposition table, then gets the hash entries and nodes, then does a search for the newest and deepest nodes in the hash table.
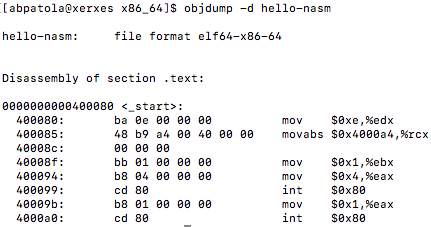
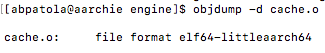
If you recall from above, inside the engine directory where our cache and hash files are located there is also a object file called cache.o. This is great to see as now we can use an old and trusted command to take a look under the hood into the assembly code what is happening on our Aarch64 server. Using objdump -d lets take a look at how the instructions are being executed…
tt_get() :
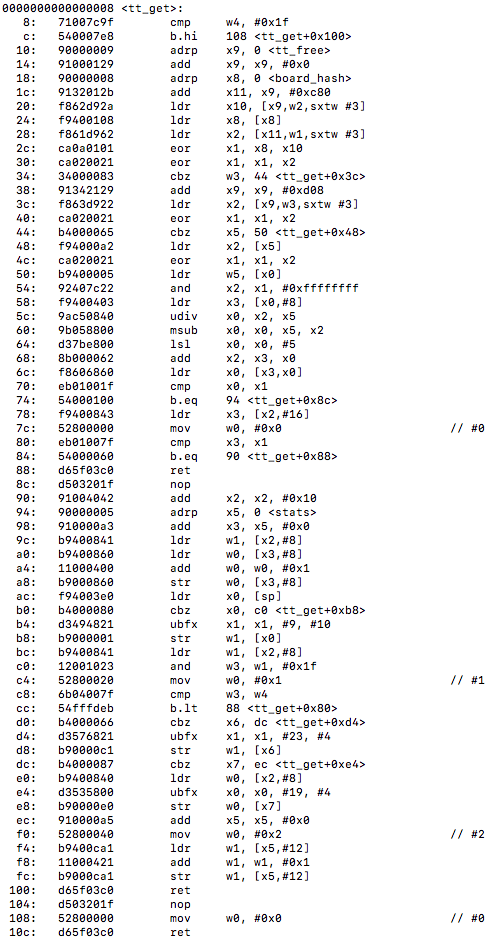
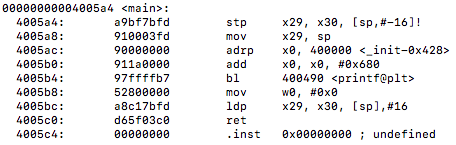
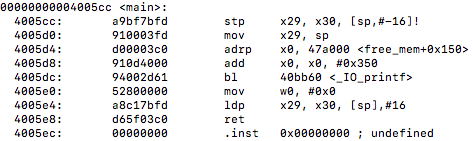
From above we can see that there is indeed no vectorization at all taking place for any of the hash table. This makes me wonder if there may be some hope after all that we can use the table vector lookup instructions to improve instructions and function calls. I also am curious to find out the optimization level at compile time and if vectorization was even attempted at all. Nonetheless we can notice some un-vectorized instructions such as adrp, ldr, mov, add, lsl, and the exclusive or operations eor being used. Also if you recall from the function there are three things taking place here which are getting the combined hash value, getting the correct entry and node, and returning the data.
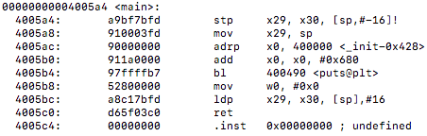
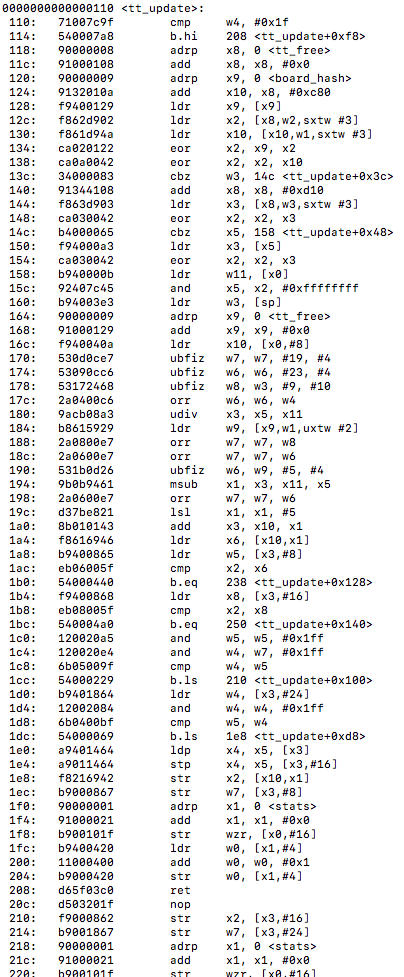
tt_update() :
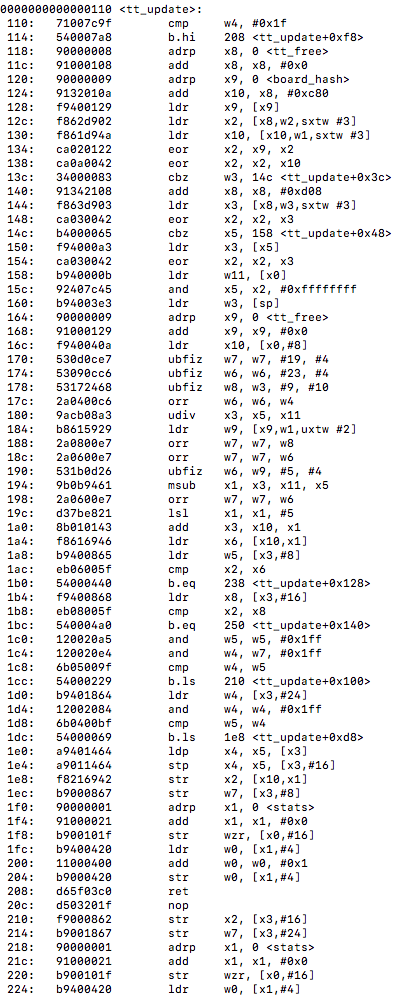
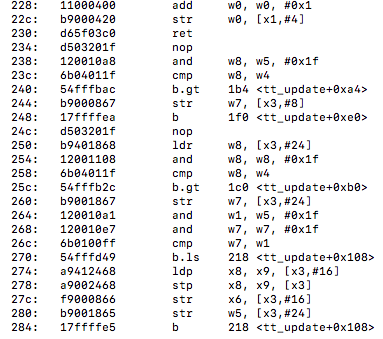
Here we are getting a combined hash value, getting the hash entry and nodes, seeing if we found an already existing node (newest/deepest), if newest is deeper than deepest, then we switch them, otherwise we replace the newest hash value. We can also notice that no vectorization or TBL instructions are taking place that hopefully we may be able to optimize at compile time for better search efficiency on the platform.
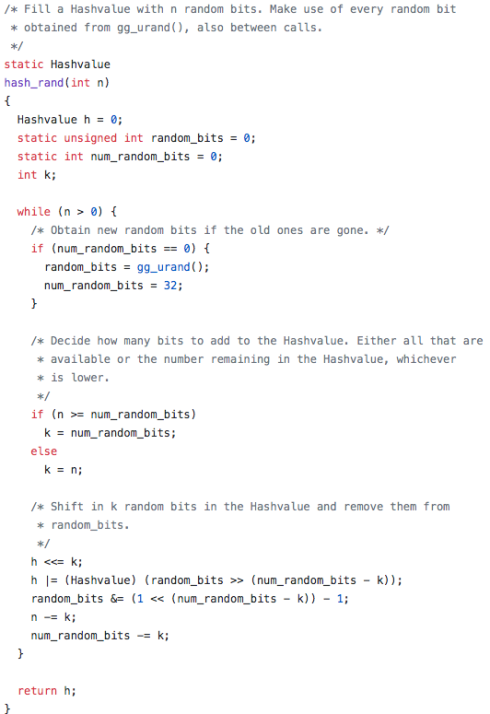
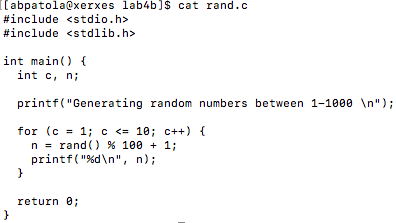
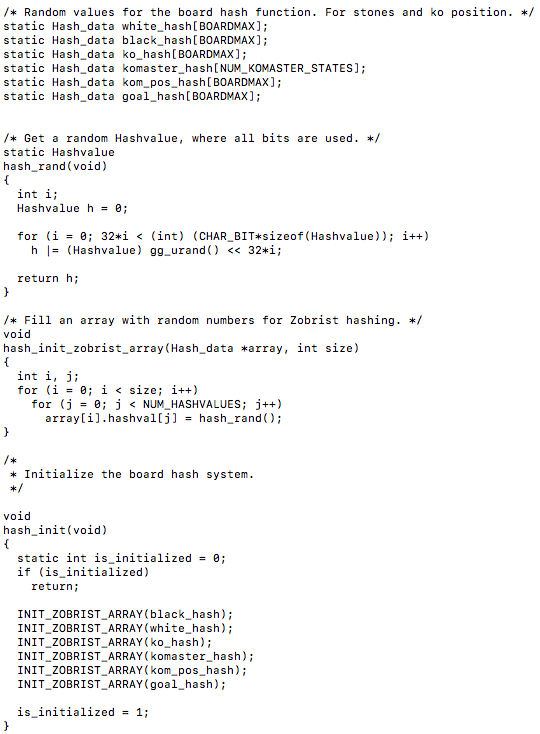
Also, I would like to look at the hash.c file to examine what is another important part of the Zobrist hash algorithm. If we can take advantage of compile time optimization maybe there are some tweaks that can be found from this files output. This file contains some interesting code, initially getting a random Hashvalue where all the bits are used and then filling an array with random numbers for Zobrist hashing, then going on to initialize the board hash system…
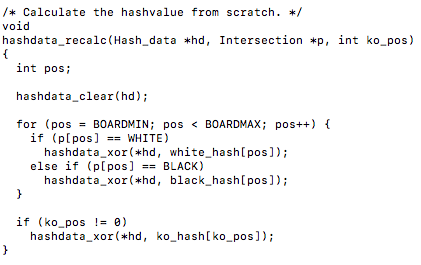
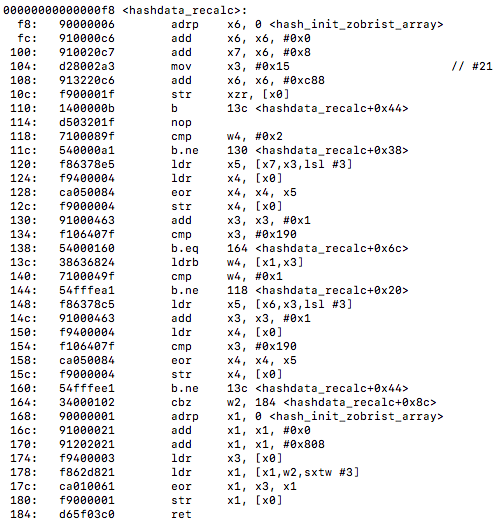
There are two noticeable hashing functions in this file, hashdata_recalc() which calculates the hash value from scratch using exclusive or operations…
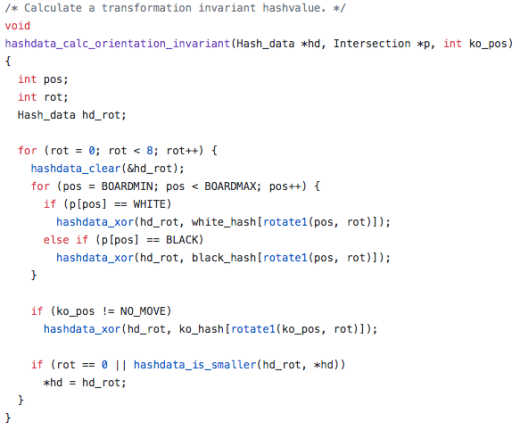
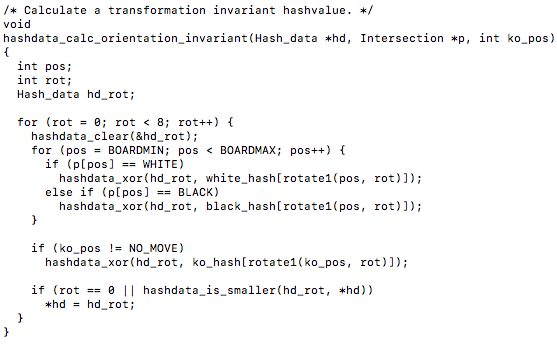
The other being a function that calculates a transformation invariant hashvalue called hashdata_calc_orientation_invariant(). An invariant in mathematics is a property that remains unchanged when transformations of a certain type are applied to the objects. You can also notice the use of the exclusive or operations here as well…
Now lets take a look at the objdump -d of these two functions from the hash.o output file…
<hashdata_recalc>:
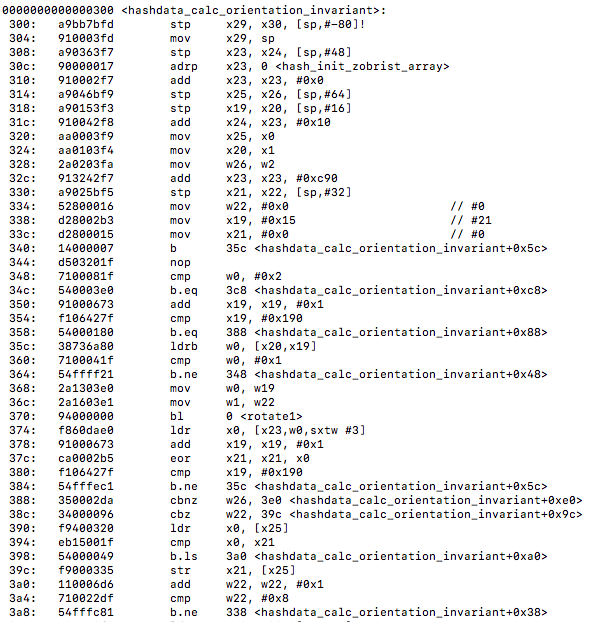
 <hashdata_calc_orientation_invariant>:
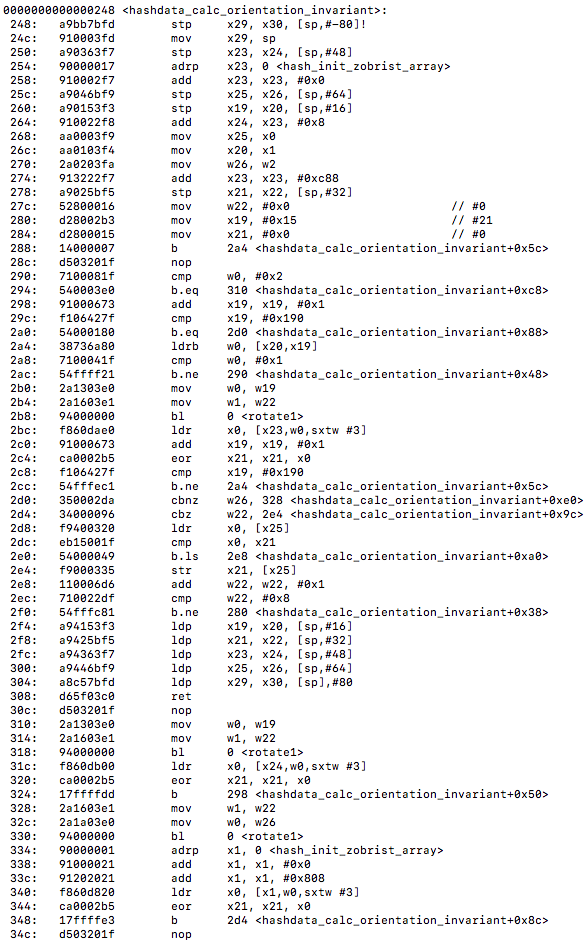
What stands out, aside from noticing no vectorization taking place, is all the branching instructions going on. I am assuming this is due to the exclusive or operations taking place inside the hash functions.
Now that we’ve learned what’s going on with the implementation of the Zobrist hash algorithm and use of transposition tables, lets move on to take a look at how these files were compiled originally.
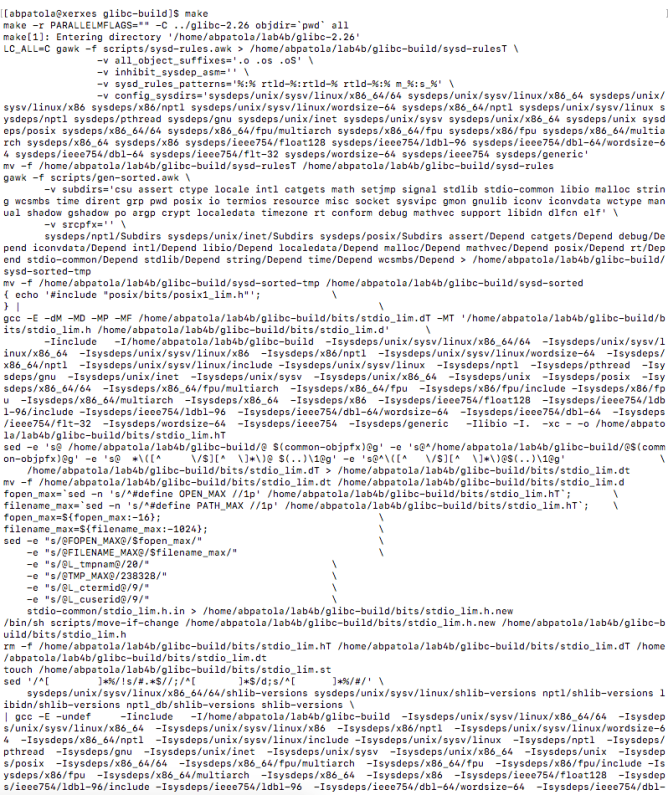
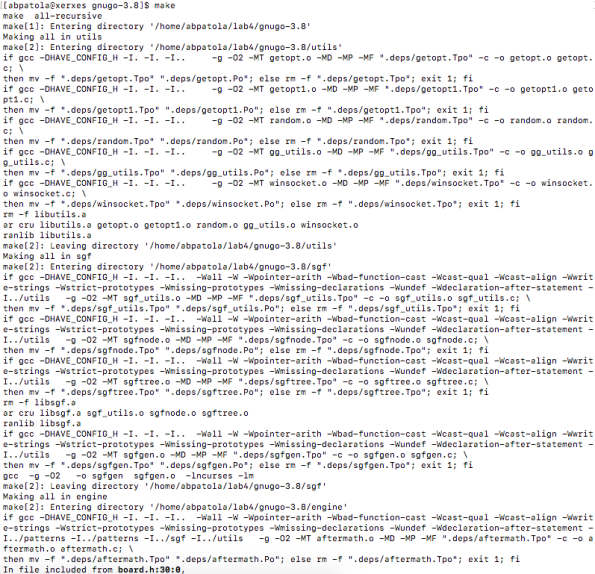
To figure out how the engine was compiled I first ran a make clean and make command to see what was happening during the build process (I will look inside the Makefile next)…
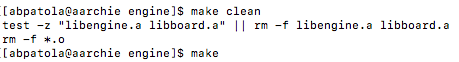
original compilation of cache.o:

original compilation of hash.o:
From above we can notice that there is a compile time flag of -O2 on the cache and hash object files. Now lets look into the Makefile to see what exactly is going on…
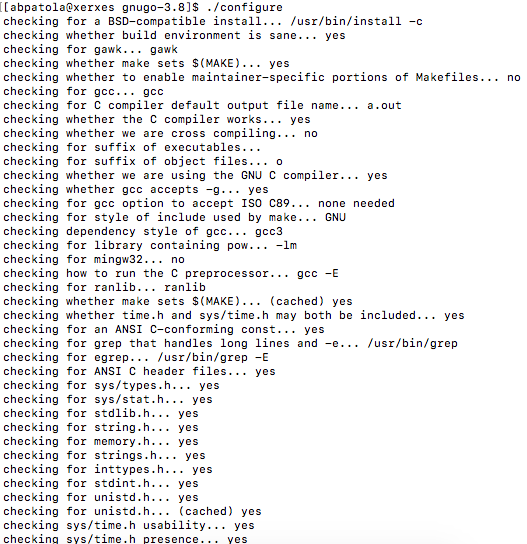
Based on the output of what the compiler was doing during the make above I can see that the -O2 flag is located in a variable called CFLAGS…
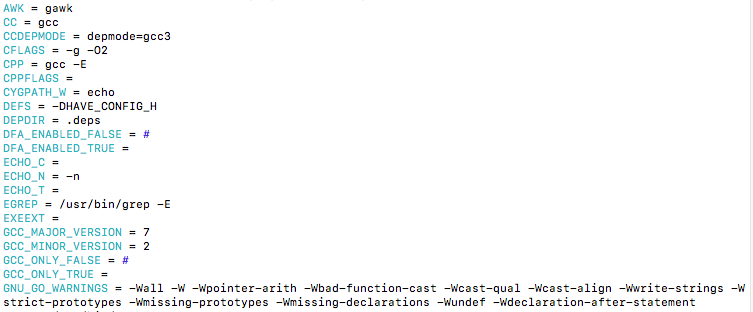
We can also notice some other flags being used as well as the compiler warnings being called upon. For our purpose we are concerned with the CFLAGS option which we will be changing from -O2 to -O3. According to the GNU manual this is called Overriding , being that each time we run make we can override the previous CFLAG value that will produce a new object file based on that option. After reading more online documentation concerning optimization flags to send to the compiler I came across an interesting one that is -march=name, this specifies the name of the target ARM architecture. GCC uses this name to determine what kind of instructions it can emit when generating assembly code. This seems like a prefect candidate to include as a compiler option. We will be using the flag -march=native which causes the compiler to auto-detect the architecture of the build computer. Ok, lets introduce these flags into the makefile…

Now lets do a make clean and a make again…
After running the commands we can now see that our flags are being used to produce the new object files…


With these optimization flags in place, lets go back and do an objdump of the new object files and take a look at the functions discussed earlier.
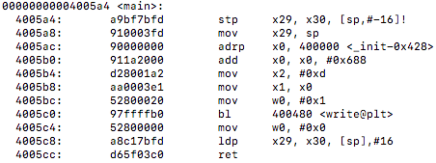
Sample of optimized <tt_update> assembly instructions (located in cache.c):
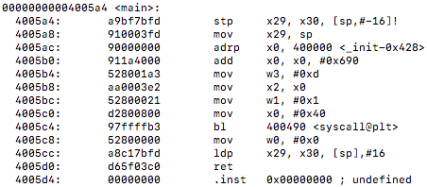
Sample of optimized <hashdata_calc_orientation_invariant> assembly instructions (located in hash.c):
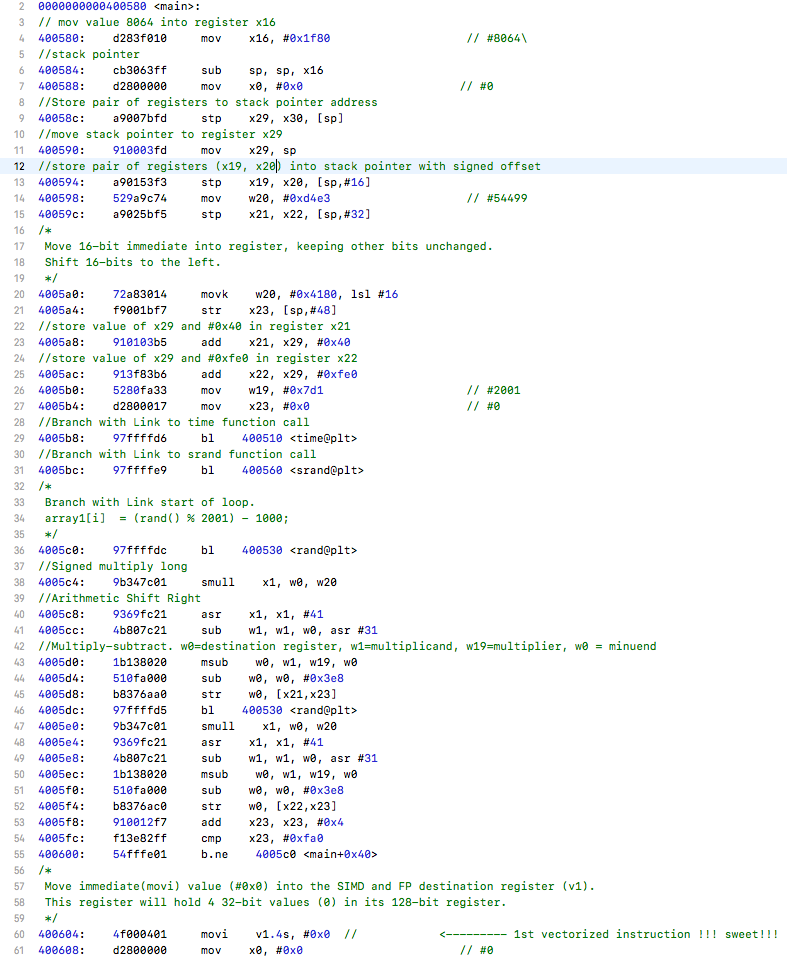
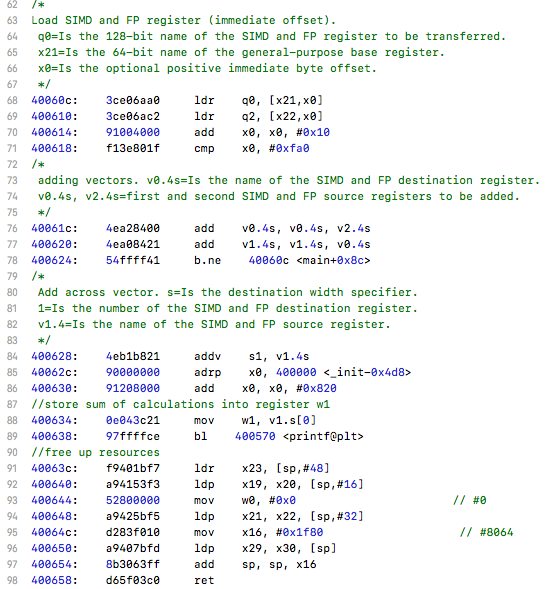
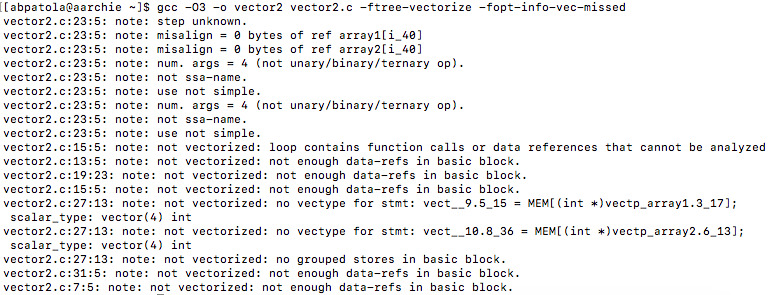
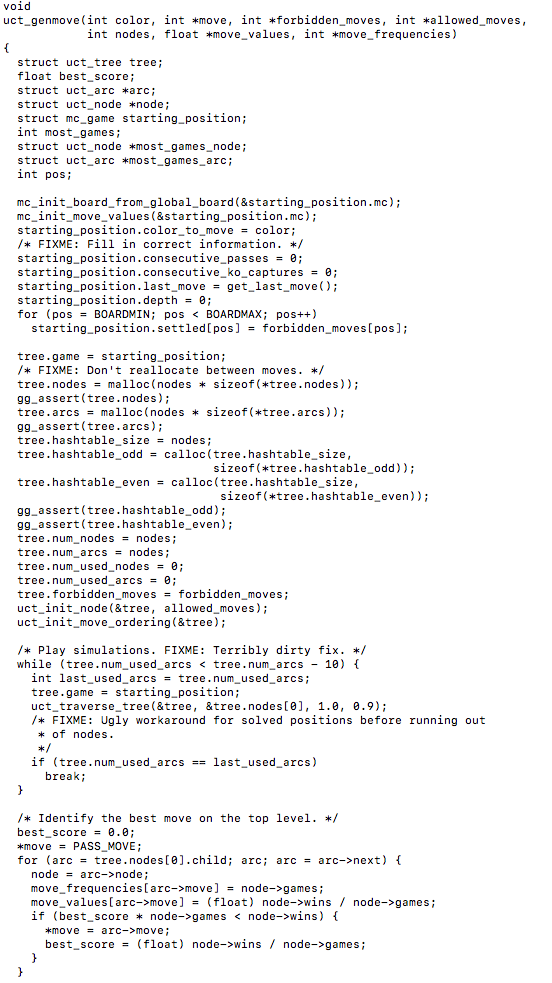
Unfortunately for us, as we can note from the above instructions, there is still no vectorization going on or vectorized table lookup instructions being used even with the updated compiler flags targeting the object files. For interest purposes I wanted to see if there was any other files or functions that may have gained some auto-vectorization from the compiler flag updates. I targeted the montecarlo.o file for this. In Monte Carlo Go the engine plays random games to the end, generating moves from a pattern database within the context of the algorithm UCT (upper confidence bounds applied to trees). In the montecarlo.c file I located a function that seemed like it would be good for these lookup purposes, the function is called uct_genmove() that searches the hash table and plays simulations to calculate the next best potential move on the board. A sample of the function looks like this…
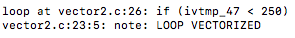
First I compiled using the original optimization flags and looked at the objdump of that object file. I then used the flag optimizations -O3 and-march=native and ran make again to produce a new object file to see if there was any difference. After comparing the disassembly of uct_genmove() against both optimization levels side by side I noticed a difference, the new optimized flags gave us vectorization!
Here is a comparison from uct_genmove():
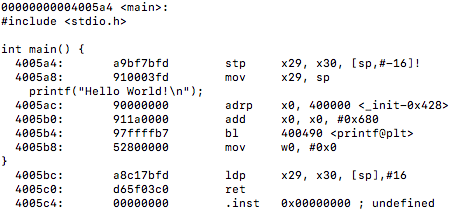
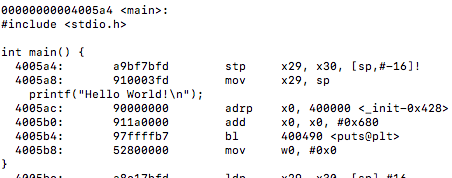
We will be using the command objdump -dS to see the source code along side the disassembly output. From a line in the function that is implemented with
gg_assert(tree.hashtable_even);
we notice the first instance of vectorization being utilized. I will show the original un-vecotrized output then the vectorized output that has the movi instructions below it…
un-vectorized:
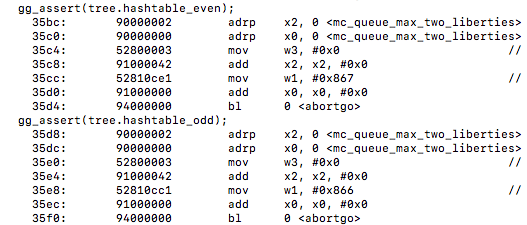
vectorized:
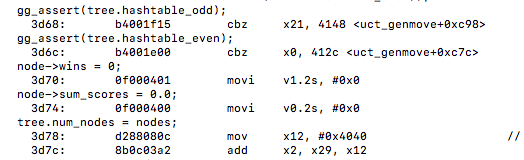
We also notice that (tree.hashtable_odd) is now only 1 instruction. We also notice the liens being vectorized are searching the nodes for winning moves and tallying the sum of the scores which originally were not being utilized as vector instructions.
The next instruction that I find that now utilizes vector instructions is labelled
mc->move_partition_lists_white[k] = 1;
un-vectorized:

vectorized:

with the line mc->move_value_sum_white = 0.0; we can notice that it is now a single vectorized move instruction unlike and add operation it was before
un-vectorized:

vectorized:

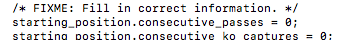
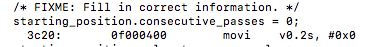
the line starting_position.consecutive_passes = 0; now has a vectorized move instruction while previously it had none…
un-vectorized:
vectorized:
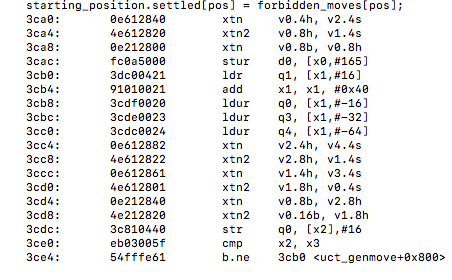
Under the line starting_position.settled[pos] = forbidden_moves[pos]; we can see many vectorized instructions being utilized with many xtn/xtn2 instructions.
un-vectorized:
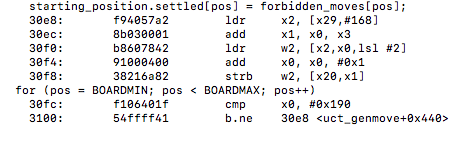
vectorized:
Wrap-up:
With successfully being able to vectorize some parts of the game engine that uses the Zobrist hashing algorithm, specifically in the Monte Carlo simulation game function uct_genmove() it would be interesting to see how this improves the efficiency of many simulated games at a time for lookup speed purposes. I wish I had focused on the Monte Carlo simulations more closely a lot sooner, as there are many AI fundamentals being relied upon. I believe if I spent time searching for a shorter program and clearer hashing algorithm I would’ve been able to produce much more efficient testing outputs which may have been easier in the end to implement. I was intrigued by the game of Go originally and this project has intrigued me even more, I believe I will continue testing out the games source files in the future. If there was one thing I wish I knew to make the overall logic of the program much easier to follow…it would be to understand the game more thoroughly as it is quite complicated for someone with zero prior knowledge outside of Chess. I will end the post here as it is rather long, hope you enjoyed the read!
***UPDATE***
After looking more into how to do any sort of testing relevant to our previous optimizations I have come across the only option I could find. under debugging command line options to use in the game I came across one that prints statistics of the games moves relevant to our Monte Carlo optimizations. Unfortunately it does not have a time to lookup option, although it does display the depth of node searches it makes in the table lookup relevant to its next move. Now lets see if there are any changes at all affecting this output…
We will be using the command line option:
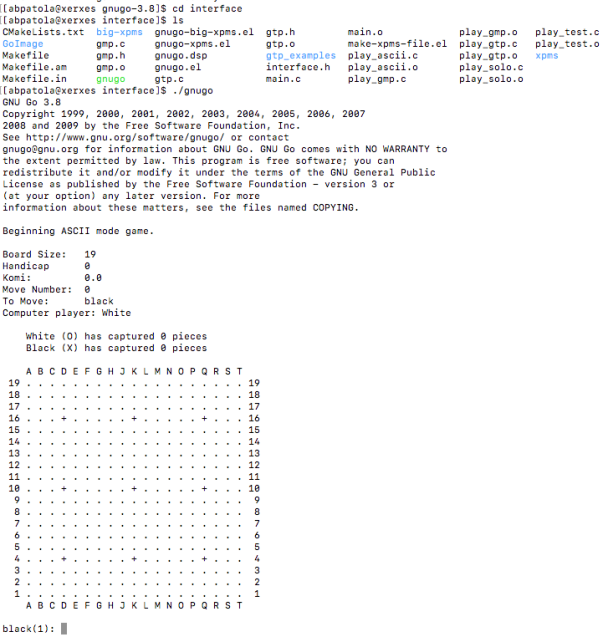
./gnugo –mc-games-per-level 10 -S
This is the default level of Monte Carlo simulations to make to consider a move. At level 10, GNU Go simulates 80,000 games in order to generate a move. Cool, lets see the results we receive with a couple of test moves…
Without optimization simulation results:
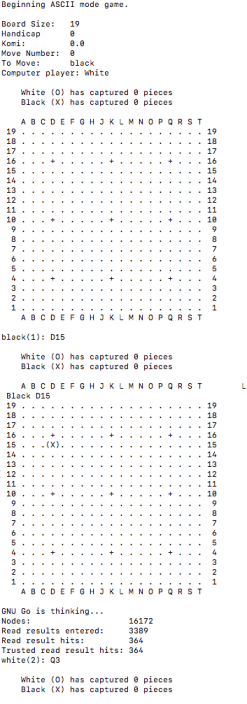
a bit clearer look at the lookup results:
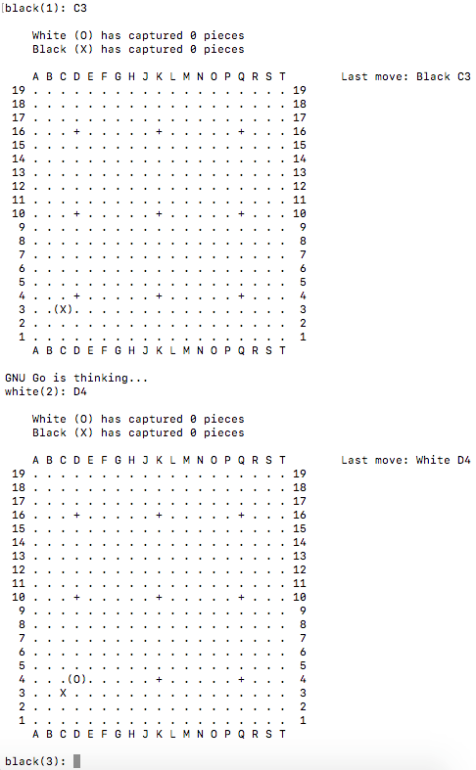
For the Monte Carlo simulation to make its best predicted move it took a search over 16,172 nodes to makes its decision to move to Q3. I then made a next move to J10 and this was the result of the simulations next best decision to makes its move to D4…

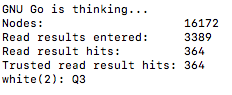
Lets see if the optimized results in the Monte Carlo file generated any different output to the search over the nodes results…
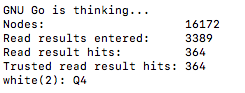
Exactly the same as the previous un-vectorized version of searching through the nodes after I made the initial move to D15. Lets try my next move of J10 again to see if its exactly the same as well after the simulation (of interest is that it moves to Q4 this time instead of Q3)…

Well for the second simulated decision of the game based on the same previous moves it searched around 2 thousand less nodes and generated a move to C3 instead of D4. It seems there may be a minimal lookup speed effect in nodes searched if anything.
This may be related to what we noticed during the vectorization of the function that generates the Monte Carlo simulations next move …

Here we can recall there is vectorized move instructions taking place for node->wins and node->sum_scores used in the function. Based on this the vectorization seems to have a minimal effect thus far in the searching through nodes in the table. I would be curious to play a whole game with tough decisions to see if there was more of a deviation in results. I also wish there was a way to test the time of the lookup speed in the developer debugging tool options.
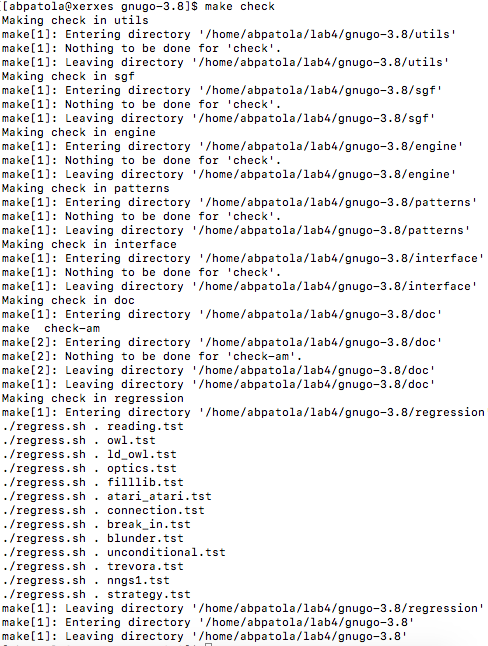
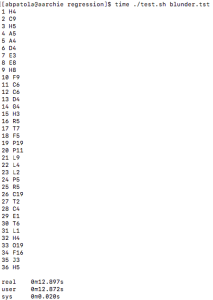
I attempted one other test located in the regression testing directory. This basically makes sure we don’t have a bug in our changed program and it outputs the same results, although here I’m more curios to see execution time. I also made sure to check if anyone else was using the server that would have a side effect on these results, and luckily I was the only one on.
![]()
Running the command with no vector instructions in game engine:
time ./test.sh blunder.tst
1st run:
I do this two more times and get these results:
2nd run:

3rd run:

Lets see if theres any changes after compiling the engine to utilize vectorization:
1st run:

2nd run:

3rd run:

As we can see there was a small improvement in the milliseconds here basically a bit over 12.8 for the unoptimized version and a bit over 12.5 for the optimized. I will be curious to keep playing around with the game files as it is a really interesting game.